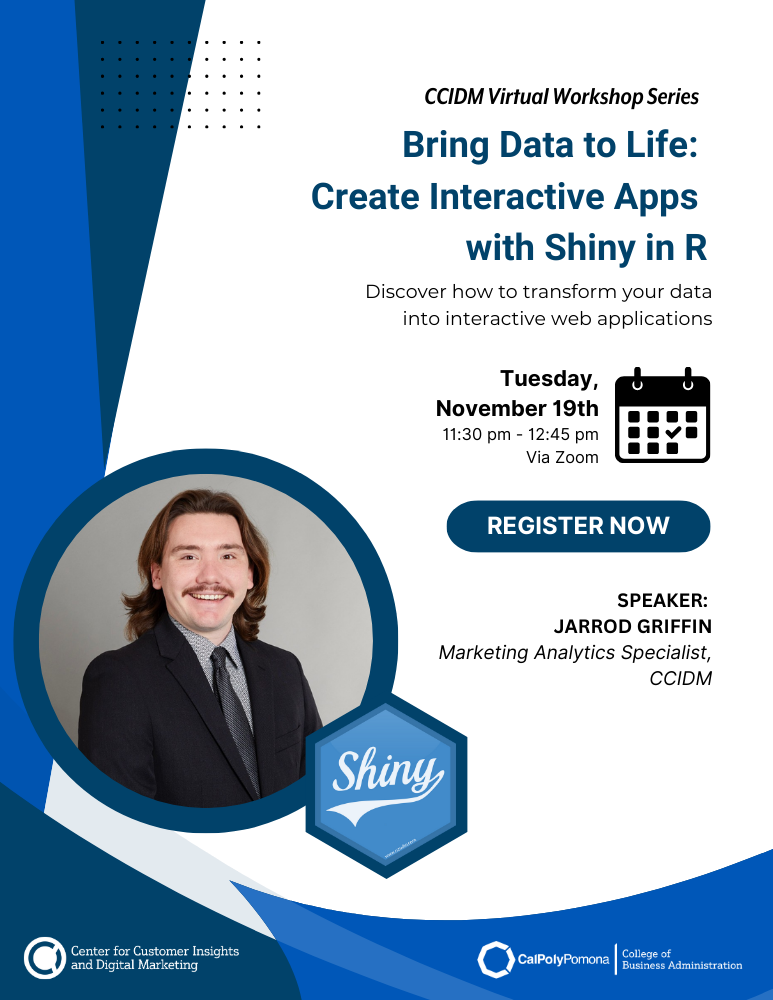
Bring Data to Life: Create Interactive Apps with Shiny in R
Bring Data to Life: Create Interactive Apps with Shiny in R
Discover how to transform your data into interactive web applications with Shiny, a powerful R package designed for creating dynamic user interfaces. In this hands-on workshop, you'll learn how to build and customize Shiny apps, create reactive data visualizations using packages like ggplot2 and plotly, and deploy your apps online. Whether you're new to programming or an R user looking to expand your skills, this workshop will guide you step-by-step through the process of turning static data into engaging, interactive experiences. The workshop will be led by CCIDM’s Marketing Analytics specialist, Jarrod Griffin, who is also a student in the Master of Science in Digital Marketing.
Learning Outcomes
- Understand Shiny App Structure: Participants will learn the fundamental architecture of Shiny apps and how to structure code using ui.R/server.R or app.R.
- Implement Reactive Programming: Attendees will gain the skills to create dynamic, interactive Shiny applications using reactive values and expressions.
- Build Interactive Data Visualizations: Participants will learn to incorporate and customize interactive plots with packages like ggplot2 and plotly for responsive data visualization.
- Deploy Shiny Apps on Various Platforms: Attendees will be able to deploy Shiny apps to platforms such as shinyapps.io and shinylive, making the apps accessible online.
- Secure Shiny Applications: Participants will learn about securing Shiny apps, including implementing authentication and understanding best practices for protecting sensitive data.

Workshop Preparation:
Accessing R and RStudio
To get the most out of this workshop, please ensure you have access to both R and RStudio. You can do this by either downloading and installing them to your computer or by setting up a free Posit Cloud account.
Options for Accessing R & RStudio:
- Posit Cloud (online option) - Get started here
- Install R & RStudio on Windows - Watch this tutorial
- Install R & RStudio on macOS - Watch this tutorial
Introduction to R & RStudio (Optional)
While not required, we encourage you to watch the following workshop beforehand if you can set aside an hour.
During the Workshop:
5:50: https://posit.cloud/

8:42:
packages <- c("shiny",
              "tidyverse",
              "shinydashboard",
              "plotly",
              "DT")

missing_packages <- packages[!packages %in% installed.packages()[, "Package"]]
if (length(missing_packages) > 0) {
  install.packages(missing_packages)
}

14:45:
library(shiny)

ui <-

server <- function(input, output) {

}

# Run the application
shinyApp(ui = ui, server = server)

23:15:
library(shiny)
library(tidyverse)
library(shinydashboard)
library(plotly)
library(DT)

post_data.df <- read_csv("https://raw.githubusercontent.com/jsgriffin96/shiny_r_workshop/refs/heads/main/data/Post%20Data.csv") %>%
  mutate(across(c("Date", "Revenue"), ~ str_extract(.x, "\\d+"))) %>%
  mutate(across(c("Date", "Revenue"), as.numeric)) %>%
  mutate(Post_Type = factor(Post_Type, levels = c("Featured Product", "Announcement", "Event Showcase", "Employee of the Week"))) %>%
  arrange(Date)

30:25:
selectInput("post_type", "Post Type:", choices = unique(post_data.df$Post_Type), multiple = TRUE),

35:07:
box(title = "Total Conversions per Day",
    status = "primary",
    solidHeader = TRUE,
    collapsible = TRUE,
    width = 12,
    plotlyOutput("conversionsTimeSeries"))

41:49:
filtered_df <- reactive({
  req(input$post_type)

  post_data.df %>%
    filter(Post_Type %in% input$post_type)
})
Complete Code and Presentation:
https://github.com/jsgriffin96/shiny_r_workshop